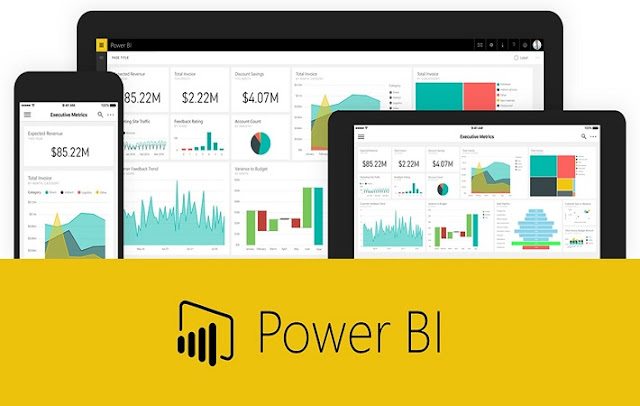
Power BI Consulting is undoubtedly the best tool for data visualisation and transformation. There are many great capabilities and featured comprised with Power BI. If you don’t know about POWER BI and its benefits, it’s time to discover it.
Following are the major benefits of power BI that you should know.

- Simplicity
You can find abundant visualisation through Power BI. This allows you to represent your thoughts and ideas in the right way. Some of them are pretty complex. You can easily show the relationship between data elements in an extraordinary way that can make sense… For example, if you are an analyst expert.
For many of us, probably 98% of us – simplicity is the way to see things better, easier, clearer. So, you need to focus on simplicity to make your ideas look clear.
In many cases, bars and lines can look boring. Well, you don’t want to go to the old school where black and white charts used to bore us in the class. By using these bars and lines, you can easily represent raw data and help the people in front of you understand the statics.
For examples, some people avoid pie charts and treemaps because all the pie fields that have the same value can’t be differentiated.
- Context
The cross-filtering feature of Power BI is the one to rely on. It indicates that once you have 2 charts with the related data in front of each other, click on one element, and the other will be filtered on whatever you click.
This feature can be helpful in the situation of data comparison, kind-of-visual drill-downs, and simple analysis.
But what might not seem obvious at this stage is you can use three different ways of filtering and connecting data to enhance analysis and make it even better.
For example, project management. You may want people to report to you on time and do it each month without any delay. By using Power BI, you can easily make it happen.
- Slicing and Dicing Filters
The concept is basic and simple, you need to slice and dice the filters to access the right data. You can easily make things in place by separating the non-relevant data from the relevant one.

- Report Filter Panel
The page-level filter is applied to all elements of the page.
The visual level filter is applied to selected visual level data. It can be useful only if you want certain background data (except charts) to be used for filters.
Report level filters are applied to all pages and become useful when a user travels through multiple pages to see all the data in the same filter context. Besides, you get different views for the same filter. When you move to the next page, the old filter is still selected that offers you the same context.
That’s all you can get from Power BI Consulting.
If you want to get all these perks for your business from power BI, get in touch with professionals.
Hire the best power BI service provider.

